
PROJECT 1: DESIGN LEADERSHIP
I was hired by ADP to start UX practice in Australia and New Zealand. While ADP employs more than 150 designers across the globe, this discipline never existed in ADP's ANZ business. My goal was to establish UX strategy for legacy to new products migrations in ANZ market, while creating design culture across the 500+ employees organization. In my tenure, I successfully established following practices -
Started and heading UX practice for ADP across Australia and New Zealand. My primary responsibility is to create and evangelize design culture across the organization and improve experience for more than 300,000 users across SMB and enterprise segments to new suite of products and services. ADP is a global provider of HR management and payroll solutions to more than 800,000 businesses in 140 countries.
PERSONAS


GOAL
Build empathy towards users within the organization
ACTIONS
1. Organized series of workshops with members from cross-functional teams to identify the user archetypes, their needs and pain points
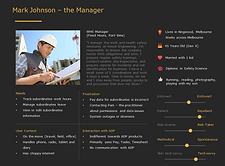
2. Defined 3 primary personas - Casual employee Ed, Manager Matt and Practitioner Pam
3. Evangelized personas by having series of brown bag sessions with cross functional teams on their importance and how to use them
RESULT
Personas are now pervasive and used to define customer types across the organization. Development teams use them to create BDDs and test scripts while Business uses it to define features in the roadmaps and scope out stories.
ETHNOGRAPHIC RESEARCH


GOAL
Establish research practice to get direct user feedback into product development process
ACTIONS
1. Pitched Field Research and Online Focus Group plans to Service and Relationship managers
2. Created talk tracks and presentation explaining the process and benefits to customers
3. Conducted field research by visiting customers in their offices and online focus groups to determine user needs and validate designs
4. Shared success stories with different teams during sprint reviews and different sessions
RESULT
Started with pilot program but expanded the user pool to 20+ clients (100+ users) and 20+ internal associates. Initial user research and design validations are now mandatory steps in product development process.


GOAL
Previously, feedback came through company administrators to Service teams. Goal was to establish a new medium to get feedback directly from company employees into product team.
ACTIONS
1. Brainstormed on ways to get quantitative feedback and identified in-product feedback and Google Analytics as quick mediums
2. Worked with the development team to add in-product feedback module and tags in Google Analytics on relevant pages and UI components
3. Track feedback on month-to-month basis
RESULT
In-product feedback module receives 10000+ feedback every month, allows tracking CSAT scores and identify bug fixes or feature requirements while Google Analytics helps us track feature adoption and engagement.
QUANTITATIVE USER FEEDBACK
DESIGN THINKING


GOAL
Increase design thinking within the organization to help build empathy for the users and adopt HCD process
ACTIONS
1. Organized brown bag sessions on Design Thinking, UX vs. UI, personas, user research process and success stories, design systems, mobile-first approach, UI performance, etc.
2. Created usability test plans, usability scripts, UX resources page in Confluence, widget library, etc.
3. Setup regular UX checkpoints, 30-60-90 design critiques, customer validations, post-implementation UI review sessions as mandatory steps in Agile process
4. Provided coaching on UX principles, best practices, taxonomy, visual design, etc.
5. Identify opportunities outside of product teams by winning a hackathon, helping stakeholders with user research, workshop facilitation, journey maps, prototypes, etc.
RESULT
UX is now perceived beyond UI and is considered an integral part of the product development process and a useful resource to leverage for other teams
PROJECT 2: HCM PLATFORM REDESIGN
Brought in as ADP Australia New Zealand's first UX Designer, I established our process and used it to lead first major redesign for its two flagship legacy products. This laid the groundwork for multiple subsequent iterations over the course of 1.5 years that resulted in surge in cross-device usage, high CSAT scores and increase in NPS score
GOAL

ADP has 2 flagship legacy products for its clients in Australia and New Zealand - 1. Payforce (for clients with 500+ employees) and 2. Payline (for clients with less than 500 employees). Using these products, the employees of our clients can view their pay slips, apply for leave, manage their personal profile, etc. Both these products have been in existence for over 25 years. The goal of this project was to completely re-imagine the employees experience by improving the usability and uplifting the design aesthetic.
MY ROLE
I headed the User Experience for this effort in collaboration with 3 Product Owners, 3 sprint teams and stakeholders across the organization at different levels and in different teams.
DURATION OF PROJECT
2 Years
CHALLENGE
ABSENCE OF ANALYTICS
1. This redesign was a global corporate initiative without any specific information about user pain points. The old portal did not support analytics to understand user behavior.
NO RESEARCH ON END-USERS
2. The feedback we got was through proxy users - our support team and client's HR administrators. Since we were redesigning employee experience for our clients, our end-users were employees and we needed to get feedback directly from them.
PROCESS
RESEARCH SETUP & PROCESS IDEATION & DESIGN VALIDATION & ITERATIONS
STEP 1: STAKEHOLDER INTERVIEWS

I conducted stakeholder interviews across different teams at regular intervals to learn about the business, learn about the users, identify the pain points and validate preliminary designs.
STEP 2: SETUP ETHNOGRAPHIC RESEARCH


I setup a first-ever ethnographic research initiative. For this initiative, I secured buy-ins from our 'customer gatekeepers' like Relationship Managers and Services team, by setting up various sessions for idea pitching, education about ethnographic research, creating a talk track and a presentation for clients. It started off with a pilot program with 3 clients, but with every successful client interaction, the pool expanded to 25+ clients. I was then able to successfully gather user requirements and validate designs with the users through user interviews, focus groups or observation sessions for every major feature redesign.
STEP 3: SETUP QUANTITATIVE RESEARCH METHODS


Created survey in Qualtrics and sent to 4000+ clients (500K+ employees). Surveys were sent for the first time in the history of organization to our clients besides NPS with the purpose to evaluate design and product. Multiple surveys were sent to evaluate new concepts or track product feature engagement and adoption. This also enabled us to create customer pool for future research.

Documented all customer interactions and created a pool of customers who agreed to participate in the future research.
RESEARCH SETUP & PROCESS IDEATION & DESIGN VALIDATION & ITERATIONS
STEP 1: CUSTOMER JOURNEY MAP


For any feature once I had a solid direction for the design, I began to produce customer journeys, Behavioral Design Diagrams (BDD) and multiple different variations of wireframes. I would then put the designs in front of internal proxy users and stakeholders for testing and feedback. This helped me to narrow the design and move into high-fidelity and interactive prototypes.
.jpg)
Defined information architecture for various modules within the product suite to identify gaps, reimagine new architecture, and validate with stakeholders.
STEP 2: WIREFRAMING & PROTOTYPING
Axure prototyping for one of the major features - Timesheets
Then I would create visual aesthetics and high-fidelity interactive prototypes using Axure. This intention of the design was to be simple, feasible, responsive and alive. This is one of the primary reasons why I went with a Mobile First approach to create a grid-based, modular structure, which would scale well across devices. The interactive prototypes brought static designs to life and the users and internal stakeholders could envision how the final product could look like.
RESEARCH SETUP & PROCESS IDEATION & DESIGN VALIDATION & ITERATIONS
CUSTOMER INTERVIEW


I ran design critique sessions with internal stakeholder and usability tests with end-users for every major feature redesign. I created a usability test plans to get consent from stakeholders, usability test scripts for users, synthesized findings in Confluence and Miro and presented findings during sprint reviews and brown bag sessions.

Sent out surveys to pilot clients and in addition followed up with them over email/phone to identify usability and functionality issues for the new features
©2017 Nishant Satanekar
IMPLEMENTATION STANDARDS & METRICS


We follow Agile scrum framework. I supported 3 sprint teams and would participated in important sprint rituals like Backlog Refinement, Sprint Planning, Reviews and Retrospectives. To incorporate UX process effectively within SCRUM framework, I introduced 'Sprint 0' for UX Research and Design at start of every sprint cycle and have 'Buddy-testing' as one of the tasks for each story at the end of each sprint cycle for implementation review with QA and Developer.
At the start of my tenure, the implementation often did not match the designs. This resulted in lot of time spent in making cosmetic fixes and increasing design debt. While closer collaboration and detailed specs helped a bit, the problem still continued. Hence, in collaboration with the lead developer, I created a visual guide and a design system aimed towards standardizing and reusing UI components. This avoided lot of rework and reduced design debt.
POST-RELEASE TRACKING

Post-release, there was no way to track feature engagement or benefits. I worked in collaboration with Product Owners to setup Google Analytics for the redesigned website and tag the features. This helped us learn which tasks were carried out the most, which devices users used and page performance. This also helped us understand where the design was performing well and identify opportunities for iterative tests.


I also needed to get qualitative feedback at scale on what are users impressions about new design, any feature requirements they might have or any bug fixes we need to make. Hence, I proposed an in-product feedback module to get this user feedback in quick and easy way. For each feedback, we track the client id, user id, user role, date/time stamp, user satisfaction rating and comment. I analyse this feedback on a regular cadence to get CSAT scores, identify trends and improvement opportunities. Through this channel we get over 10,000 submissions per month.
FINAL DESIGNS & RESULTS
Final designs from one of the major features - Timesheets
Over 1.5 years, over 1M employees were migrated to the new platform across all market segments.
The new design was intuitive to an extent that no help guide was created for the first time.
The usage on mobile and tablets surged from 0% to over 40%
Product CSAT has been over 80% based on over 10,000/month user responses